

Estimated reading time: 1 minute
With tephpy installed, a real radiosonde ascent on a real
tephigram is a few lines. The sounding ships with the package,
so there is nothing to download first.
import matplotlib.pyplot as plt

from tephpy import samples

snd = samples.sounding("norman-12z")

fig, ax = plt.subplots(subplot_kw={"projection": "tephigram"})
ax.plot_sounding(snd)
ax.legend()
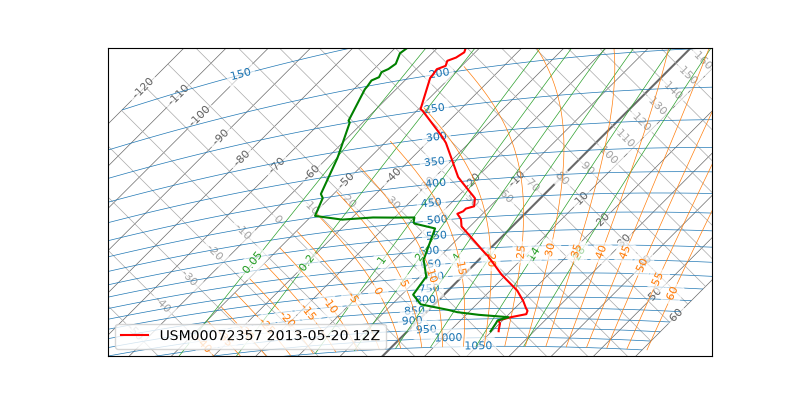
That is Norman, Oklahoma on the morning of 2013-05-20. The two traces are temperature and dewpoint; everything behind them is the diagram’s own grid.
You now have the thing this documentation is about. What you do not yet have is a way to read it, which is what Your First Tephigram is for — it draws this same ascent and names every line on it.