

Note
Go to the end to download the full example code.
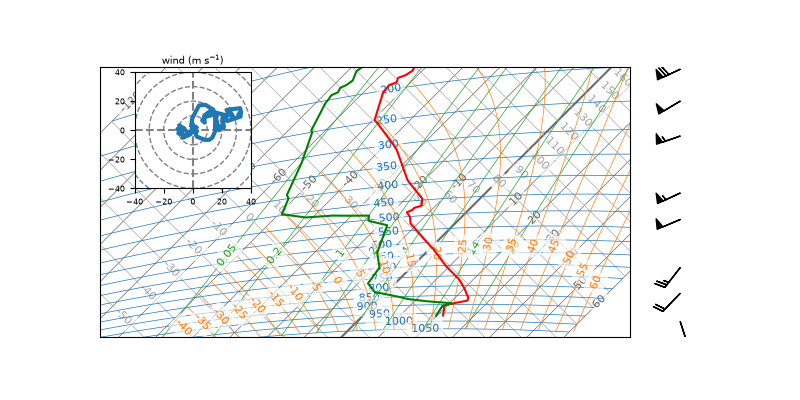
A Hodograph inside a Tephigram#
tephpy draws the tephigram and leaves the hodograph to MetPy,
so the wind profile goes in an inset over the diagram’s top-left corner, drawn
from the same Sounding.
A tephigram shows the thermodynamic profile and a hodograph the wind profile, and a forecaster reads them together. Insetting the hodograph keeps the tephigram at the figure’s full width; side by side, the two panels halve it and neither is comfortable to read.
The sounding is Norman, Oklahoma at 12Z on 2013-05-20.
from __future__ import annotations

from typing import TYPE_CHECKING

import matplotlib.pyplot as plt
from metpy.calc import wind_components
from metpy.plots import Hodograph

from tephpy import samples

if TYPE_CHECKING:
    from matplotlib.figure import Figure


def main() -> Figure:
    """Draw a tephigram with the sounding's hodograph inset.

    Returns
    -------
    matplotlib.figure.Figure
        The composed figure.
    """
    snd = samples.sounding("norman-12z")
    fig, ax = plt.subplots(figsize=(8.0, 4.0), subplot_kw={"projection": "tephigram"})
    ax.plot_sounding(snd)
    ax.plot_barbs(snd)
    # Axes fractions, not data. The top-left is the cold, low-theta corner
    # the profiles never reach, so the inset hides background isopleths and
    # no part of the ascent.
    inset = ax.inset_axes((0.02, 0.55, 0.31, 0.43))
    hodograph = Hodograph(inset, component_range=40.0)
    hodograph.add_grid(increment=10.0)
    hodograph.plot(*wind_components(snd.wind_speed, snd.wind_direction))
    # MetPy plots pint quantities, so matplotlib labels both inset axes
    # "meter/second"; the title states the unit once instead.
    inset.set_xlabel("")
    inset.set_ylabel("")
    inset.tick_params(labelsize=6.0)
    inset.set_title("wind (m s$^{-1}$)", fontsize=7.0)
    return fig


if __name__ == "__main__":
    main()
    plt.show()
Total running time of the script: (0 minutes 0.597 seconds)