

Note
Go to the end to download the full example code.
Parcel Analysis#
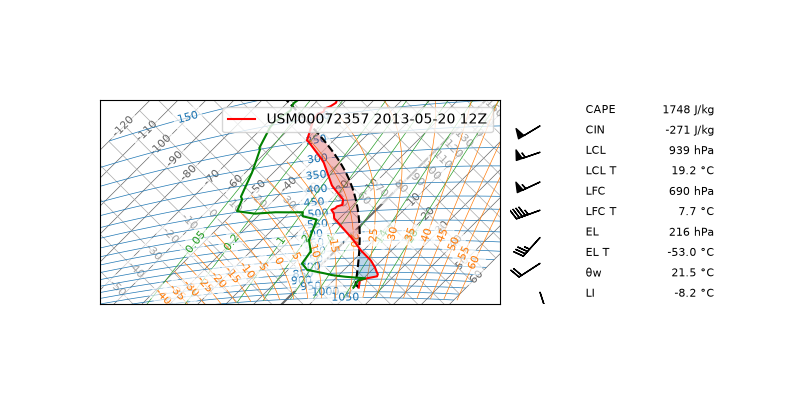
Lift a parcel from the surface, shade the energy available to it, and annotate the indices that summarise the parcel ascent.
The sounding is Norman, Oklahoma at 12Z on 2013-05-20 — the morning of the Moore EF5 tornado, with about 1750 J/kg of CAPE under a -271 J/kg cap.
from __future__ import annotations

from typing import TYPE_CHECKING

import matplotlib.pyplot as plt

import tephpy
from tephpy import samples

if TYPE_CHECKING:
    from matplotlib.figure import Figure


def main() -> Figure:
    """Draw the parcel analysis.

    Returns
    -------
    matplotlib.figure.Figure
        The composed figure.
    """
    snd = samples.sounding("norman-12z")
    fig, ax = plt.subplots(figsize=(8.0, 4.0), subplot_kw={"projection": "tephigram"})
    ax.plot_sounding(snd)
    ax.plot_barbs(snd)
    parcel = tephpy.calc.parcel_path(snd)
    ax.plot_profile(parcel, color="k", linestyle="--")
    ax.shade_cape(snd, parcel)
    ax.shade_cin(snd, parcel)
    ax.annotate_indices(tephpy.calc.indices(snd))
    ax.legend()
    return fig


if __name__ == "__main__":
    main()
    plt.show()
Total running time of the script: (0 minutes 1.521 seconds)