

Note
Go to the end to download the full example code.
The Tephigram#
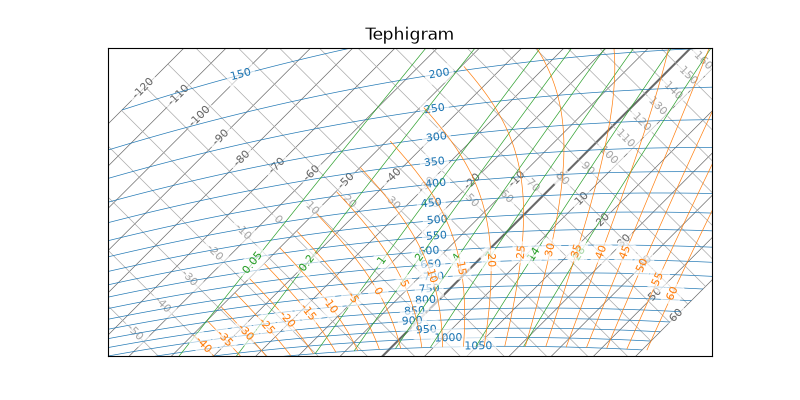
The bare diagram: the five isopleth families of a tephigram, on a coordinate system rotated so that the isotherm and dry adiabat families cross at right angles.
The projection is registered by importing tephpy, and the extent is given as a pressure range and a temperature range.
from __future__ import annotations

from typing import TYPE_CHECKING

import matplotlib.pyplot as plt

import tephpy  # registers the "tephigram" projection

if TYPE_CHECKING:
    from matplotlib.figure import Figure


def main() -> Figure:
    """Draw a tephigram over a chosen extent.

    Returns
    -------
    matplotlib.figure.Figure
        The composed figure.
    """
    fig, ax = plt.subplots(figsize=(8.0, 4.0), subplot_kw={"projection": "tephigram"})
    # The ranges the diagram already frames itself with, restated so the
    # example shows how to reframe it. `tests/examples` pins them to the
    # default, so a change to that default cannot leave this figure behind.
    ax.set_extent(pressure=(900.0, 200.0), temperature=(-65.0, 5.0))
    ax.set_title("Tephigram")
    return fig


if __name__ == "__main__":
    main()
    plt.show()
Total running time of the script: (0 minutes 0.176 seconds)