

Emphasise a Reference Isopleth#
Estimated reading time: 6 minutes
Forecasters read a tephigram against a handful of reference lines — the
0 °C isotherm for the freezing level, −20 °C for the cold limit of the
airframe icing band, a mandatory pressure level. The emphasis option
distinguishes any member of any isopleth family.
The Freezing Level, Already Drawn#
One member arrives emphasised. The Met Office draws its printed tephigram’s
isotherms at 10 °C intervals and, in the next breath, records that “the line
representing the 0 °C isotherm is coloured red on the diagram”
[MetOffice23]. tephpy follows the first half in its isotherm
interval and now the second half too, so a fresh diagram distinguishes the
freezing level with no argument at all:
import matplotlib.pyplot as plt

import tephpy  # registers the "tephigram" projection

fig, ax = plt.subplots(subplot_kw={"projection": "tephigram"})
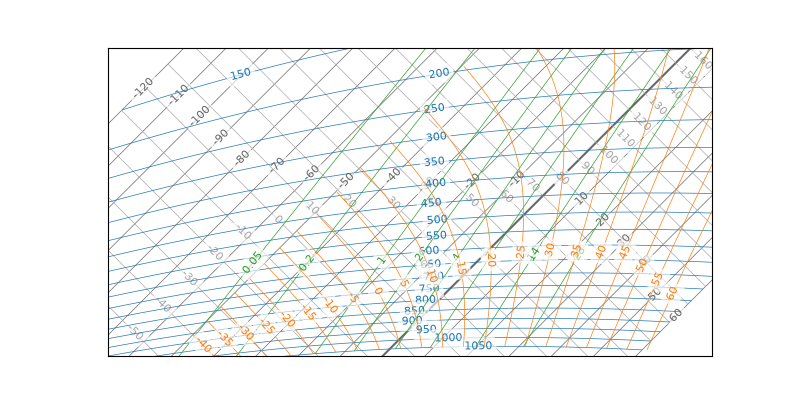
The distinction is cited; the means is not. Red is the temperature
profile’s
colour, so a red isotherm would clash with the ascent on the commonest figure
the package draws, and the factsheet gives no colour for the plotted ascent to
settle that against. The member keeps its family’s ink and draws at 1.5 pt
instead of the usual 0.5 pt — the printed-chart idiom of same ink, heavier
line — which is what an empty style means anywhere, and what
ax.isotherms(emphasis={0.0: {}}) would ask for explicitly.
It is the only member tephpy emphasises out of the box, and the only one
with a published convention behind it. Everything below is how to change it.
Colour and Dashes#
Any of color, linewidth, linestyle and alpha overrides that
default, so the airframe icing band’s bounds can carry their own styling:
ax.isotherms(
    emphasis={
        0.0: {"color": "tab:cyan"},
        -20.0: {"color": "tab:cyan", "linestyle": "--"},
    }
)
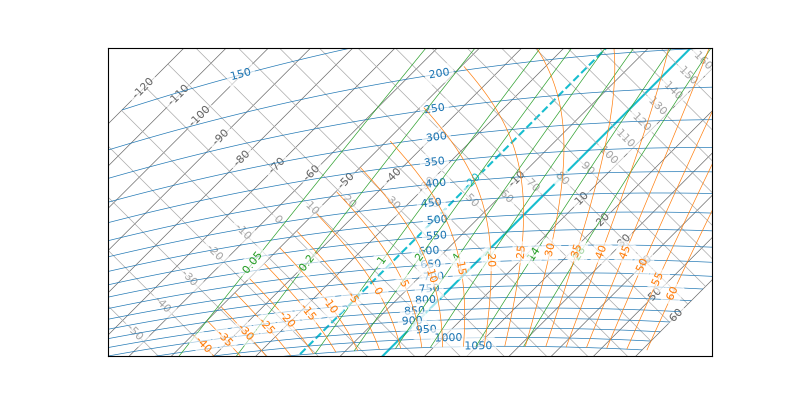
An omitted key falls back to the family’s own style, so
{0.0: {"linestyle": "--"}} is a dashed member in the family’s colour at the
emphasis width.
Values the Interval Never Lands On#
An emphasised member is always drawn, whatever the zoom ladder would select, so the dendritic growth zone’s −12 °C and −18 °C bounds appear even though no isotherm interval includes them:
ax.isotherms(
    emphasis={
        -12.0: {"color": "tab:purple"},
        -18.0: {"color": "tab:purple"},
    }
)
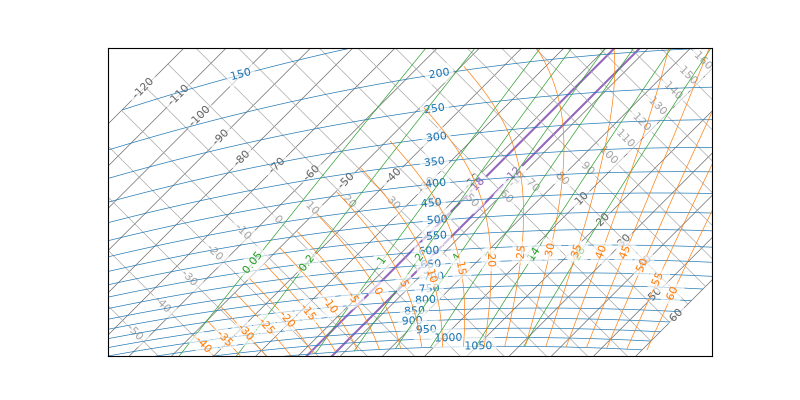
A value outside the diagram’s domain is a no-op — it is simply never in view. That is silent on the analytic families (isotherms, dry adiabats and isobars); the curved moist adiabats and mixing ratios build through MetPy, which can warn about a far-out value before the diagram ever gets to ignore it, so emphasise a value those families actually cover.
Every Family, Every Tier#
The option is the same on all five families, so a mandatory pressure level is the same gesture:
fig, ax = plt.subplots(subplot_kw={"projection": "tephigram"})
ax.isobars(emphasis={500.0: {}})
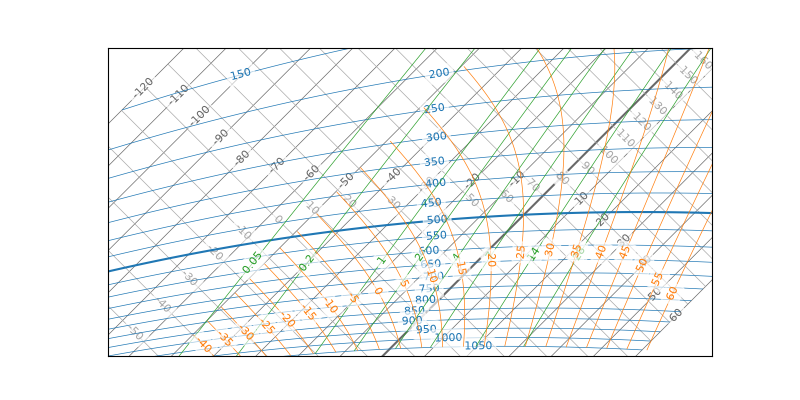
and it takes the usual precedence — the accessor keyword over
tephpy.config over the convention default.
The Two Least-Shown Families#
emphasis is one of seven options every family answers to — values,
color, linewidth, alpha, labels, emphasis and visible.
ax.mixing_ratios(...)
and
ax.moist_adiabats(...)
take them like the rest:
fig, ax = plt.subplots(subplot_kw={"projection": "tephigram"})
ax.mixing_ratios(emphasis={4.0: {"color": "tab:green", "linewidth": 2.0}})
ax.moist_adiabats(emphasis={20.0: {"color": "tab:red", "linewidth": 2.0}})
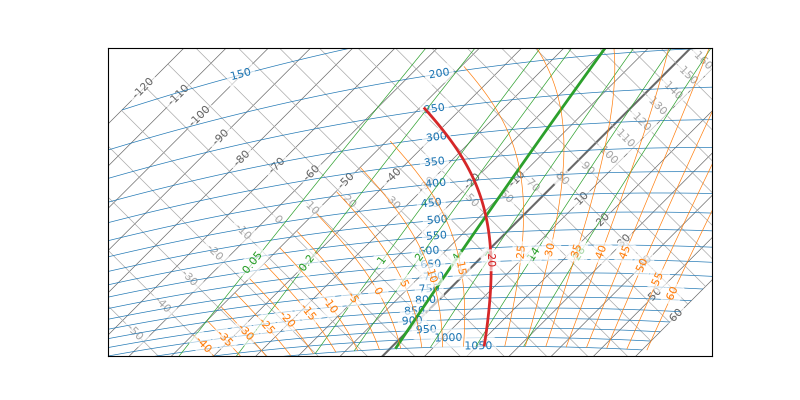
Beyond those seven the five are not interchangeable, and the two differences are worth knowing before you go looking for an option that is not there.
mixing_ratiostakes nointervalThe other four do. The ladder runs
0.05, 0.1, 0.2, 0.5, 1, 1.5, 2, 3, 4,
5, 7, 10, 14, 20, 28, 40
g kg⁻¹ — wider apart the higher it climbs — so there is no single interval that would describe it. Givevaluesinstead.moist_adiabatstakes atruncationNo other family has one, and it is a temperature rather than a pressure: the value in °C below which the curves stop being drawn, because below it they have converged onto the dry adiabats. It defaults to −50 °C, which is the Met Office’s own convention [MetOffice23].
Configure It Once#
A family reads tephpy.config when the axes is created, and re-reads it on
ax.clear(), so the configuration has to be in force before the diagram it
should apply to exists. tephpy.config.context() scopes it to exactly
that:
with tephpy.config.context(isotherms={"emphasis": {0.0: {"color": "tab:red"}}}):
    fig, ax = plt.subplots(subplot_kw={"projection": "tephigram"})
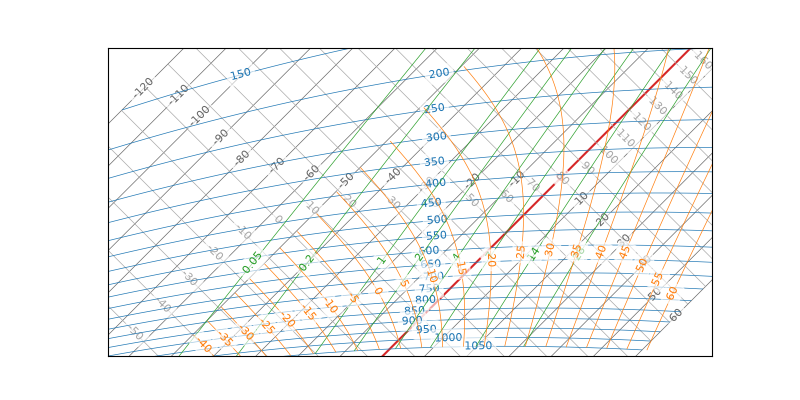
Setting tephpy.config.isotherms.emphasis directly does the same thing and
keeps doing it, for every axes created afterwards, until something puts it back.
Reach for that where a house style is the point — a configuration file
(Configure tephpy From a File) is the tidier home for one — and for a single
diagram prefer the accessor keyword the sections above use.
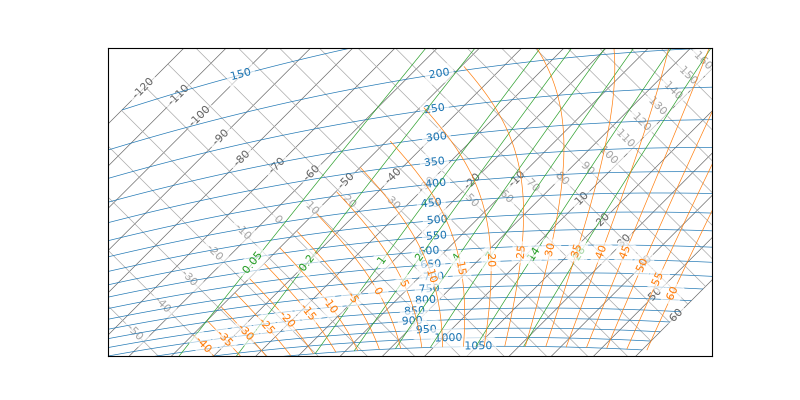
Passing an empty mapping at the accessor emphasises nothing, which is how one diagram opts out — of a configured emphasis, and of the shipped 0 °C one:
ax.isotherms(emphasis={})
Note
Emphasis reaches a member’s line and its inline label. Where a family labels a diagram edge instead, that edge’s tick marks and tick labels take one colour for the whole family — matplotlib styles ticks per axis, not per tick — so an emphasised member’s edge tick is placed but not recoloured.