

Frame the View#
Estimated reading time: 3 minutes
Two questions, two answers. Frame this neatly is ax.fit(...) with a pressure clamp; make
these figures directly comparable is ax.set_extent(...).
Fit to the Data, and Say Which Layer#
fit guarantees that nothing you give it falls outside the frame. On a
whole radiosonde ascent that is not what you want:
import matplotlib.pyplot as plt

import tephpy

sounding = tephpy.samples.sounding("norman-17z")
fig, ax = plt.subplots(subplot_kw={"projection": "tephigram"})
ax.fit(sounding)
ax.plot_sounding(sounding)
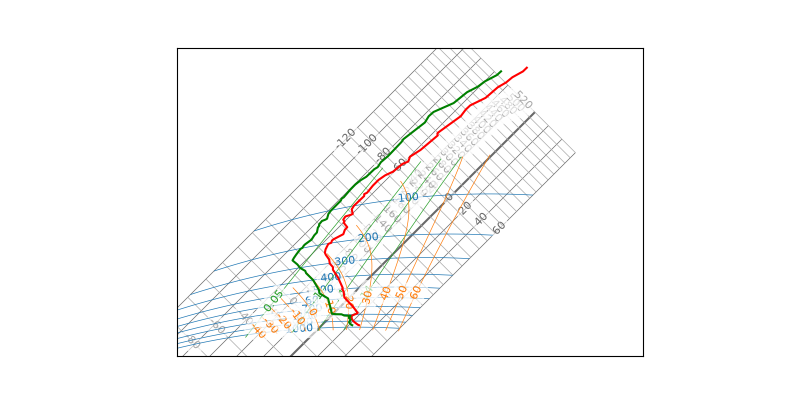
The ascent reaches about 10 hPa, and potential temperature climbs steeply through the stratosphere, so framing all of it spends the diagram on air nobody was asking about. Name the layer instead:
fig, ax = plt.subplots(subplot_kw={"projection": "tephigram"})
ax.fit(sounding, pressure=(950.0, 300.0))
ax.plot_sounding(sounding)
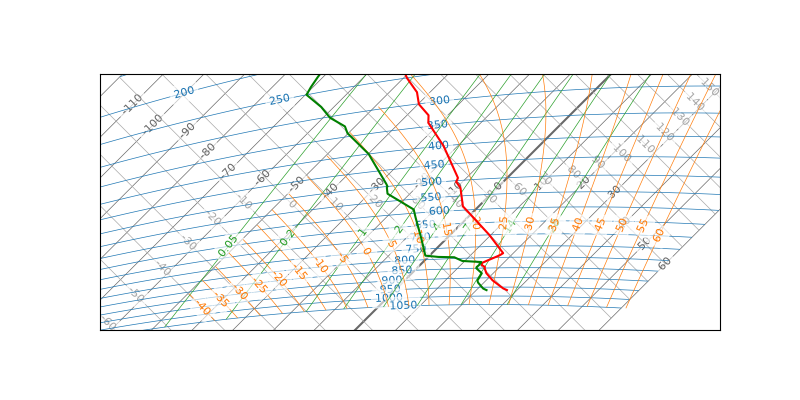
Same call, same data, one argument. Levels outside the band no longer bound the view.
Include the Parcel#
A lifted parcel is warmer than its environment through the CAPE region, so a view fitted to the sounding alone can clip the parcel ascent the analysis exists to show. Pass it too:
parcel = tephpy.calc.parcel_path(sounding)

fig, ax = plt.subplots(subplot_kw={"projection": "tephigram"})
ax.fit(sounding, parcel, pressure=(950.0, 300.0))
ax.plot_sounding(sounding)
ax.plot_profile(parcel)
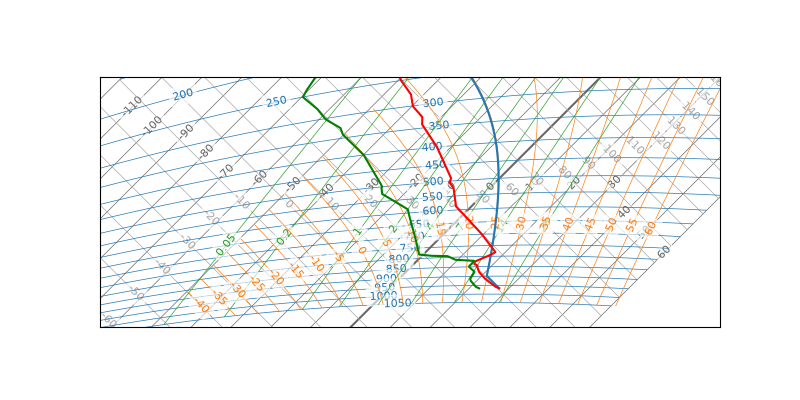
fit is variadic, so several ascents frame alike — a station’s day in
one window is ax.fit(*ascents, pressure=(950.0, 300.0)).
Fix the View by Ranges#
When two figures must be directly comparable, name the window outright:
fig, ax = plt.subplots(subplot_kw={"projection": "tephigram"})
ax.set_extent(pressure=(950.0, 300.0), temperature=(-50.0, 5.0))
ax.plot_sounding(sounding)
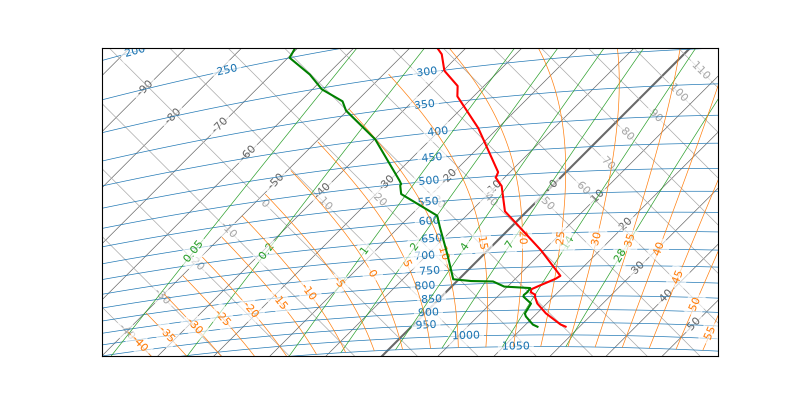
Order within a range does not matter, and both keywords are required.
Because the view is an axis-aligned rectangle and pressure is not an axis,
it always reaches a little further than the ranges name — see
set_extent for
what the default extent actually spans.
Leave Room, or None#
margin is a fraction of the fitted span, added to each side. Set it
per call, or once in a configuration file as diagram.margin:
fig, ax = plt.subplots(subplot_kw={"projection": "tephigram"})
ax.fit(sounding, pressure=(950.0, 300.0), margin=0.0)
ax.plot_sounding(sounding)
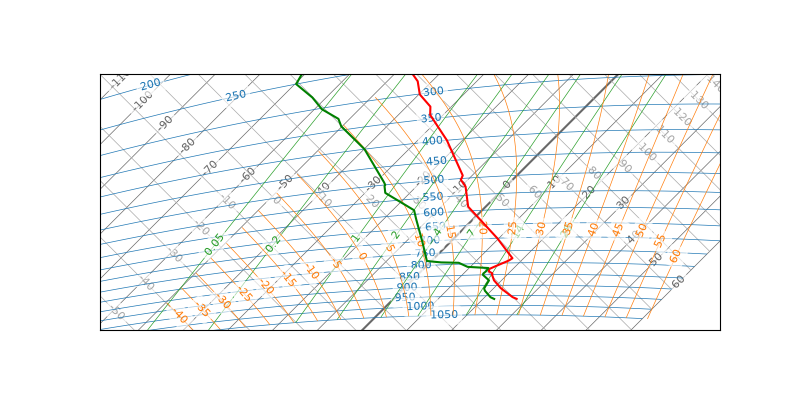
margin=0 fits exactly, which is what composing panels whose frames
must agree to the pixel wants.