

Add the tephpy Logo#
Estimated reading time: 4 minutes
add_logo() brands a figure or an axes in one call.
It draws an matplotlib.offsetbox.AnnotationBbox, so the logo is a
normal artist — returned for restyling, and removable.
On the Plot or Around It#
What you call it on decides what the position is relative to, exactly as
legend() does. Pass the axes to place the logo
inside the plotting box, or the figure to place it against the figure edges —
in the margin, clear of the diagram:
import matplotlib.pyplot as plt

import tephpy  # registers the "tephigram" projection
from tephpy.plotting import add_logo

fig, ax = plt.subplots(subplot_kw={"projection": "tephigram"})
add_logo(ax, loc="lower right")
add_logo(fig, loc="upper left")
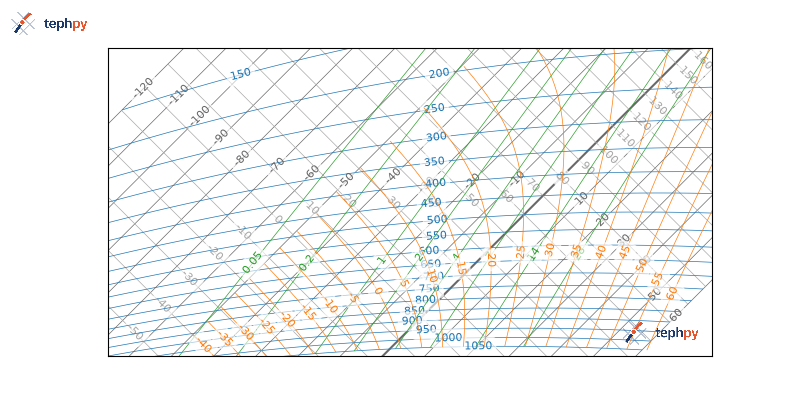
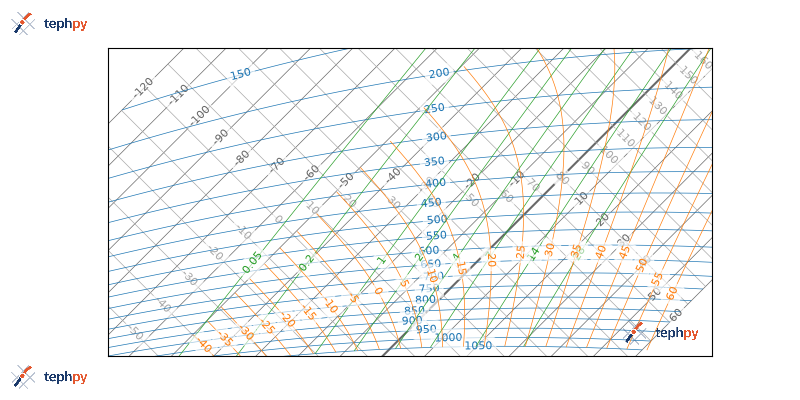
Calling it with no target at all brands the current figure, which is what you want at an interactive prompt:
add_logo()
Size and Form#
size is a height in inches, so the logo renders the same size on screen
at 100 dpi and in a 600 dpi figure for print. The "small" and "large"
presets are per form, because the three forms give the wordmark different shares
of their height:
fig, ax = plt.subplots(subplot_kw={"projection": "tephigram"})
add_logo(ax, form="stacked", size="large", loc="upper left")
add_logo(ax, form="icon", size=0.25, loc="lower right")
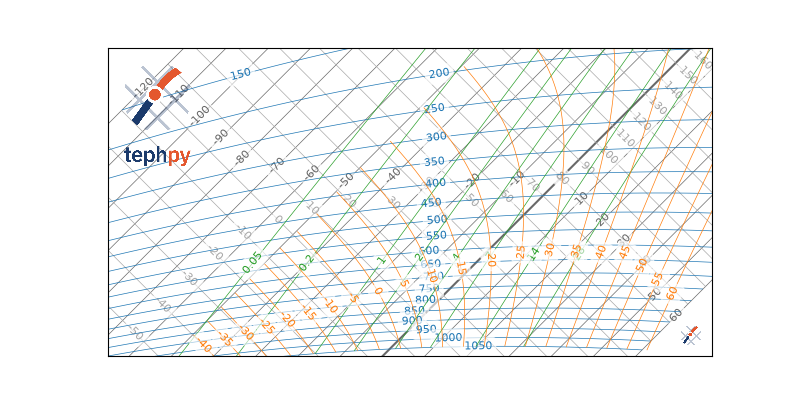
Use form="lockup" — the default — where there is room for the wordmark,
"stacked" where the space is taller than it is wide, and "icon" only
where the mark is already recognised.
Light and Dark#
theme names the background the logo is drawn on, not the ink. The
default, "auto", reads the target’s facecolor, so the right variant appears
without being asked for on a white figure and under a dark style alike:
with plt.style.context("dark_background"):
    fig, ax = plt.subplots(subplot_kw={"projection": "tephigram"})
    add_logo(ax)  # draws the dark-background variant
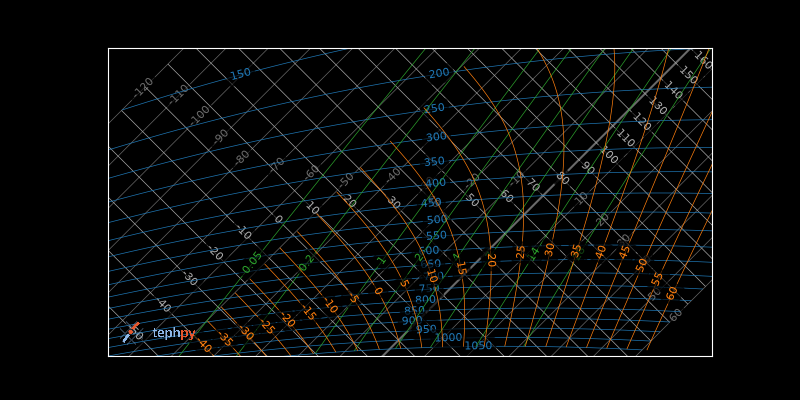
The diagram travels with it. Each inline isopleth label sits in a box
tinted
from the canvas under it, read the same way theme="auto" reads it, so the
label dims the lines beneath its value instead of blotting them out — on a
black canvas as on a white one.
Override it when you are compositing the figure onto something else, or where
savefig(transparent=True) is in play: that call does not change any
facecolor, it overrides alpha at draw time, so "auto" still reads white and
picks the light variant — correct for a figure destined for a white page,
wrong for a dark one. Say which you meant:
add_logo(ax, theme="dark")
fig.savefig("sounding.png", transparent=True)
Exact Placement#
loc takes the legend() placement strings, with
pad setting the gap in points from the edge. loc="best" is not among
them: add_logo() does no collision detection, and
silently guessing wrong is worse than saying so.
For a position no string names, pass an (x, y) pair in the target’s fraction
coordinates. It places the logo’s lower-left corner and ignores pad:
fig, ax = plt.subplots(subplot_kw={"projection": "tephigram"})
add_logo(ax, loc=(0.42, 0.05))
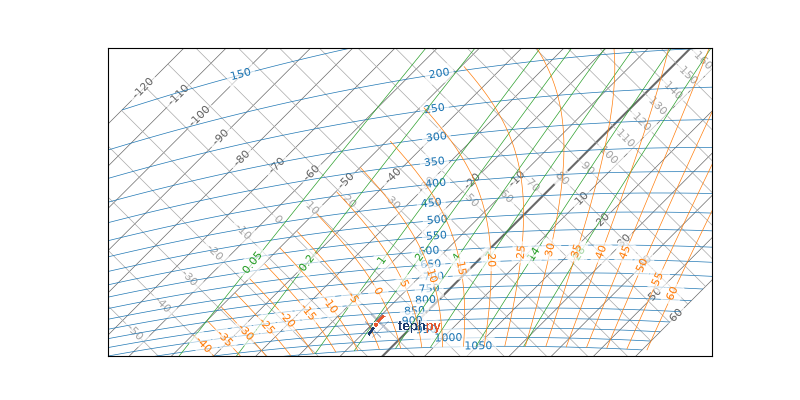
Coordinates outside [0, 1] are allowed and put the logo outside the box,
which is one way to caption a figure below its axes.
Restyling and Removal#
The returned artist is yours:
fig, ax = plt.subplots(subplot_kw={"projection": "tephigram"})
logo = add_logo(ax, alpha=0.6, size="large", loc="upper left")
logo.set_zorder(0)  # behind the isopleths rather than over them
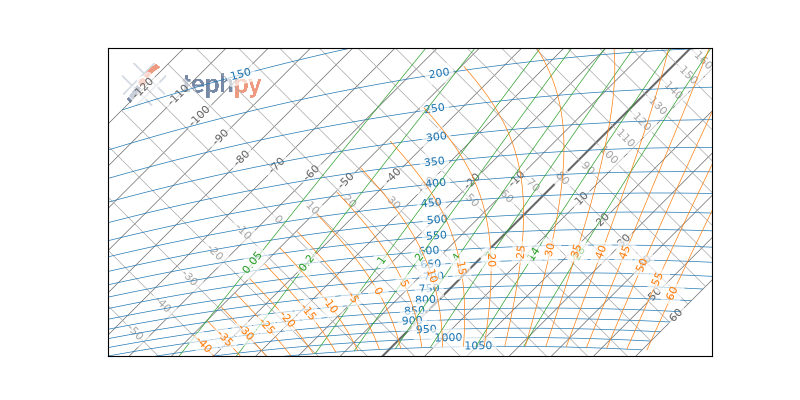
logo.remove() # changed your mind