

Label and Compose the Diagram#
Estimated reading time: 4 minutes
A fresh tephigram carries no axis titles, because no isopleth family has asked for an edge. This page claims one, puts the diagram beside something else, and writes the result out for a paper.
Move the Labels to an Edge#
Every family labels its own lines inline by default — that is labels=True.
Naming an edge instead moves those labels there, and claiming an edge brings
its axis title with it:
import matplotlib.pyplot as plt

import tephpy

fig, ax = plt.subplots(subplot_kw={"projection": "tephigram"})
ax.isobars(labels="left")
ax.isotherms(labels="bottom")
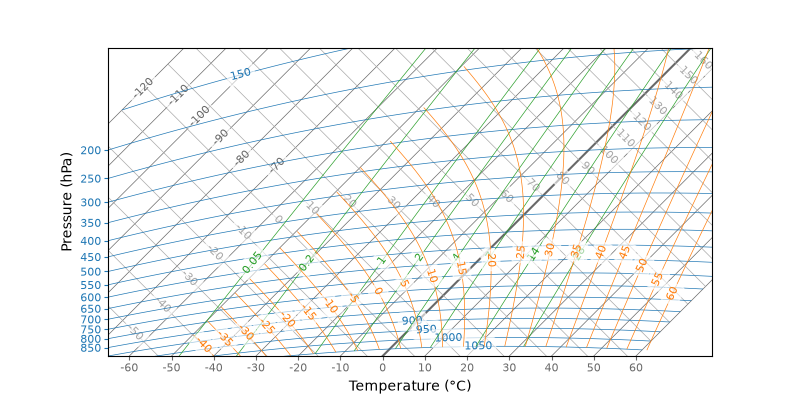
That is the whole gesture. The left axis reads “Pressure (hPa)” and the bottom “Temperature (°C)” with nothing further asked for, because a family that claims an edge supplies that edge’s title.
One family per edge. Asking for one another family already holds raises
TypeError naming the holder — the 'left' edge is already labelled by
'isobars'.
Retitle an Edge#
ax.edge_axis(...) reaches
a claimed edge to override what it says. It hands back a plain
matplotlib.axis.Axis, so everything matplotlib offers applies:
ax.edge_axis("left").set_label_text("pressure (hPa)")
ax.edge_axis("bottom").set_tick_params(labelsize=8.0)
An edge nothing has claimed has no axis to hand back, and asking for one raises
ValueError telling you to claim it first. That ordering is the point:
labels= first, edge_axis second, and only when the supplied title is not
the one you want.
Beside Another Axes#
A tephigram holds a fixed aspect ratio, which is what keeps its geometry honest. Put one in a subplot beside a plain axes and it shrinks inside its slot while the neighbour fills its own:
from tephpy import samples

snd = samples.sounding("camborne-igra-12z")

fig = plt.figure(figsize=(9.0, 4.5))
ax = fig.add_subplot(1, 2, 1, projection="tephigram")
ax.plot_sounding(snd)
other = fig.add_subplot(1, 2, 2)
other.plot(snd.temperature.magnitude, snd.pressure.magnitude)
other.invert_yaxis()
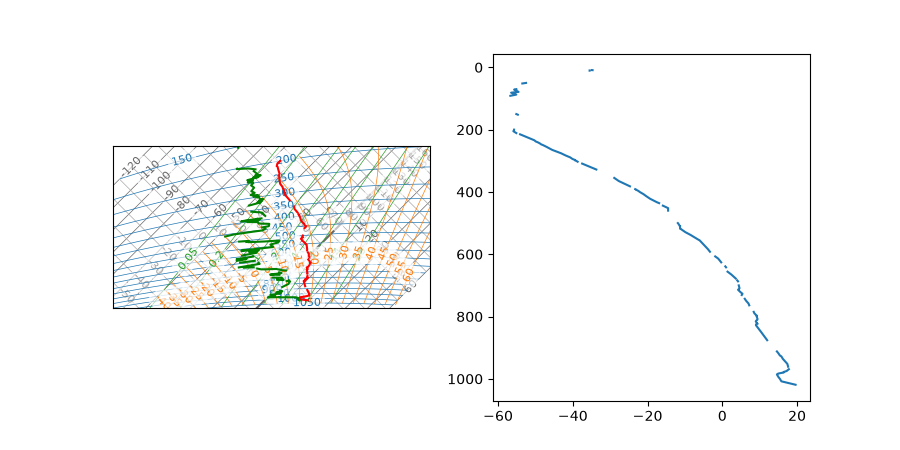
Nothing is wrong, and the pair reads as though something is: the tephigram ends up under half the height of its neighbour. Give it the wider share of the figure, constrain the layout, and ask the neighbour for a square box:
fig = plt.figure(figsize=(11.0, 5.0), layout="constrained")
grid = fig.add_gridspec(1, 2, width_ratios=(1.4, 1.0))
ax = fig.add_subplot(grid[0], projection="tephigram")
ax.plot_sounding(snd)
ax.isobars(labels="left")
ax.isotherms(labels="bottom")
right = fig.add_subplot(grid[1])
right.plot(snd.temperature.magnitude, snd.pressure.magnitude)
right.invert_yaxis()
right.set_box_aspect(1.0)
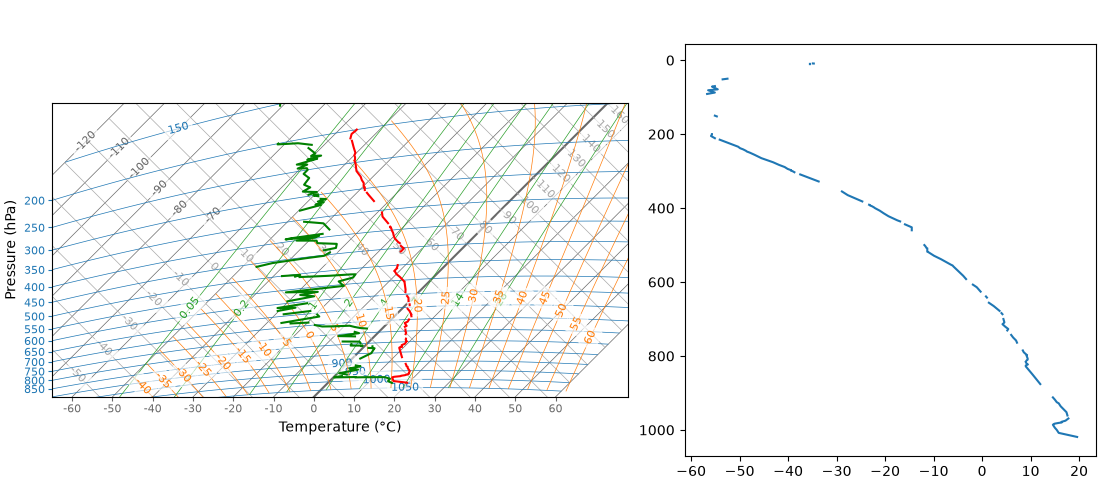
Reach for fig.add_gridspec(...) rather than
matplotlib.pyplot.subplots() here. subplots takes a single
subplot_kw, which it applies to every axes it makes, so it cannot give one
of them the tephigram projection and leave the other plain. A grid spec hands
out slots and lets each one be filled separately, and it is also where
width_ratios lives.
matplotlib.pyplot.subplot_mosaic() reaches the same place through
per_subplot_kw={"a": {"projection": "tephigram"}}, if you would rather name
your axes than index them.
Write It Out as Vector#
savefig is matplotlib’s and needs nothing from tephpy:
fig.savefig("sounding.pdf") and fig.savefig("sounding.svg") both produce
true vector output. Every line, label and shaded area is drawing instructions
rather than pixels — an SVG of a full ascent carries several hundred <path>
elements and no embedded raster at all — so the figure survives whatever scale a
publisher puts it at.
Where to Go Next#
Frame the View chooses which region the diagram shows, which is the question this page assumes you have already answered.